

In my opinion Angular 2 is a great framework to work with. But as a developer, you know that you will also need great debug features in order to have a good experience developing.
There are multiple IDEs you can use to develop in Angular 2, but for this article I will talk about Visual Studio Code – VSCode. It has great typescript support and the auto-suggest knows about the angular 2 components.
Typescript is good when developing, the learning curve is smooth, but be aware that browsers don’t know how to run .ts files. This is why you will have to “transpile” your code. Transpiling is the process of converting your code from typescript to javascript(es6).
In order to be able to debug your tarnspilled code, the compiler will automaticaly generate for *.js.map files for you. This files are mandatory for debugging typescript.
Let’s talk about debugging now. We will talk about 2 options to debug you Angular 2 app.
-
Debugging in Google Chrome
To debug you code in Google Chrome, you will have to open the developer tools(ctrl + shift + i). Go to sources tab, and search for your *.ts files. Add your breadkpoints, and run your code and wait for your breakpoints to be hit. Sourcemaps will make this possible for you. Here is a picture about how it looks:

-
Debugging in VS Code
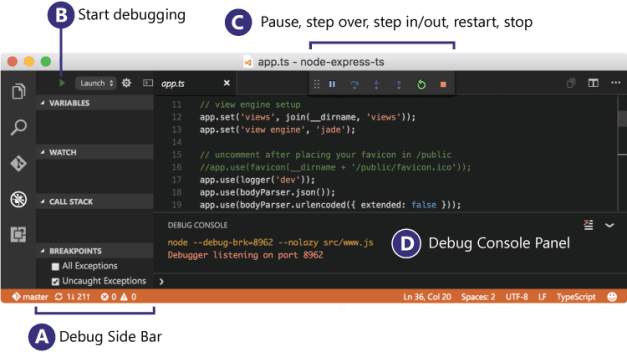
It is good to be able to debug in Google Chrome, but if you use VS Code to write your code, it will be nice to be able to debug using your IDE. The IDE has a dedicated view, just for debug, if you open it, you will see something similar to this:
Before you can start the debugging, you will need to install a vscode extension for google chrome, called “Debugger for Chrome”. Go to their app store, the 4th tab in the left search for it and hit install.
You will now need to edit a file called “lanch.json”, where you will configure what browser you will use, and how will your IDE use sourcemaps to be able to halt on breakpoints.
Here is the configuration I use for my project, in order to debug typescript from vscode.
{
“version”: “0.2.0”,
“configurations”: [
{
“name”: “Launch Chrome against localhost, with sourcemaps”,
“type”: “chrome”,
“request”: “launch”,
“url”: “http://localhost:4200/”,
“sourceMaps”: true,
“webRoot”: “${workspaceRoot}”,
“sourceMapPathOverrides”: {
“webpack:///C:/playground/angular2/practice/*”: “${workspaceRoot}/*”
}
}
]
}
If you will have problems with your sourcemaps, just remember the option of sourceMapPathOverrides. This will specify to your IDE where it will be able to find them. You will have to replace “C:/playground/angular2/practice/*” with the path of your project.
After this you will just have to hit run, and set breakpoints.
Happy debugging !!

Welcome back! 🙂 Great article and very helpful!
LikeLike
Pingback: Debugging Angular 2 | GDG Pitesti